How to structure Cost Data using Breakdown Structures

Working as a project controller, you will very likely encounter long lists of commitments, actuals, and other cost data that need to be reported on a frequent basis. To ease the job of structuring the project data, breakdown structures prove to be the answer. They allow otherwise flat data to be viewed from many angles, serving the needs of the various stakeholders in the project, e.g. management, clients, and engineers.
Breakdown structures for business intelligence
You are probably familiar with the Work Breakdown Structure (WBS) or Cost Breakdown Structure (CBS) when it comes to handling the project cost data. It has become a common practice for a WBS to be a required project cost management tool on most contracts and the CBS is often used for cost accounting and reporting. Breakdown structures can also be used to generate all kinds of cost database reporting and can become an essential business intelligence tool for a project.
Focusing on the right budget item
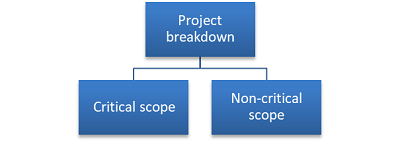
For example, a cost report can be structured by separating the critical and non-critical budget items. This simple distinction makes it possible to focus your attention on the activities that drive the project’s performance, instead of being clouded by the less important data.
The figure below shows the S-curves describing the current approved budget (red), as it is planned to be spent, compared to the actual expenditures (blue). The actuals are extrapolated up to the end of the project, indicating a slight underrun of the budget.
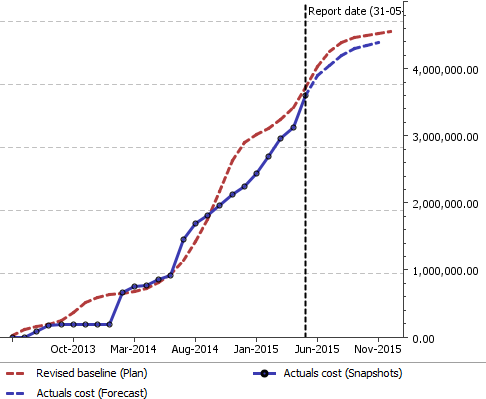
This seems like a favorable situation, but mind you, this is the graph of the total project cost information. The total actual cost at any time is the sum of possibly many individual costs that run over and under the budgeted values. Some of these actuals have a significantly larger impact on the project outcome than others. Therefore, it is wise to filter out the less critical parts and re-evaluate the case.
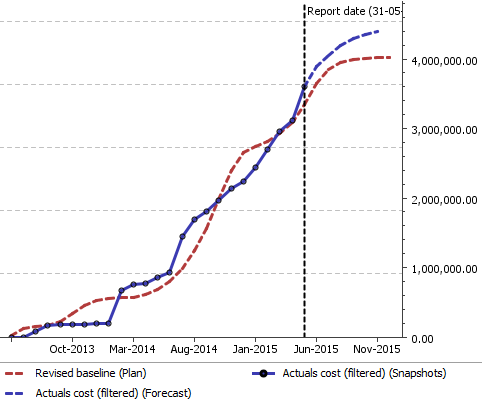
Figure 2 filters out the less critical parts and shows only the critical project scope. As you can see, this figure provides a totally different view from the one above, one that even shows a predicted overrun of the budget! To conclude, breakdown structures help you structure your cost data and reveal your project’s real performance.
If you’d like to talk to someone about our cost database, CESK Data, please feel free to contact us.